
75 lines
3.6 KiB
Markdown
75 lines
3.6 KiB
Markdown
# Prometheus metrics showcase
|
|
|
|
This is an example application that showcases how Watermill may be monitored with Prometheus metrics.
|
|
|
|
The docker-compose bundle contains the following services:
|
|
|
|
#### Golang
|
|
|
|
A [Golang](https://hub.docker.com/_/golang) image which runs the [example code](https://github.com/ThreeDotsLabs/watermill/blob/master/_examples/basic/4-metrics/main.go). It consists of a router with a single handler.
|
|
|
|
The handler consumes messages from a [Gochannel PubSub](https://github.com/ThreeDotsLabs/watermill/tree/master/message/infrastructure/gochannel), and publishes 0-4 copies of the message with a preconfigured random delay.
|
|
|
|
Additionally, there is one goroutine which produces messages incoming to the handler with a gochannel publisher, and another goroutine which consumes the messages outgoing from the handler.
|
|
|
|
The router, the standalone publisher and the standalone subscriber are all decorated with the metrics code and their statistics will appear in the dashboard.
|
|
|
|
#### Prometheus
|
|
[Prometheus](https://hub.docker.com/r/prom/prometheus/), to scrape the metrics which the golang application exposes at `:8081/metrics` by default. It is configured by a [prometheus.yml](https://github.com/ThreeDotsLabs/watermill/blob/master/_examples/basic/4-metrics/prometheus.yml) file, which declares the endpoints that Prometheus will scrape.
|
|
|
|
#### Grafana
|
|
[Grafana](https://hub.docker.com/r/grafana/grafana), to visualize the metrics in a dashboard.
|
|
|
|
#### Running the example
|
|
|
|
To run the docker-compose bundle, go to `_examples/metrics` and execute:
|
|
|
|
```
|
|
docker-compose up
|
|
```
|
|
|
|
The golang app will start running, producing messages, passing them through the handler, and consuming the copies.
|
|
|
|
With default settings, the raw Prometheus metrics should appear at your http://localhost:8081/metrics.
|
|
|
|
The Prometheus image should expose a more advanced UI at http://localhost:9090/graph, where you can investigate all the scraped metrics.
|
|
|
|
However, what is the most useful way to monitor is through the use of Grafana, which you can access at http://localhost:3000.
|
|
|
|
#### Adding the Prometheus data source to Grafana
|
|
|
|
The fresh Grafana image should greet you with a login screen:
|
|
|
|

|
|
|
|
Just use the default `admin:admin` credentials. You can skip changing the password, if you wish.
|
|
|
|
The next thing that we need to do is to add the Prometheus data source. Click on `Add data source`.
|
|
|
|
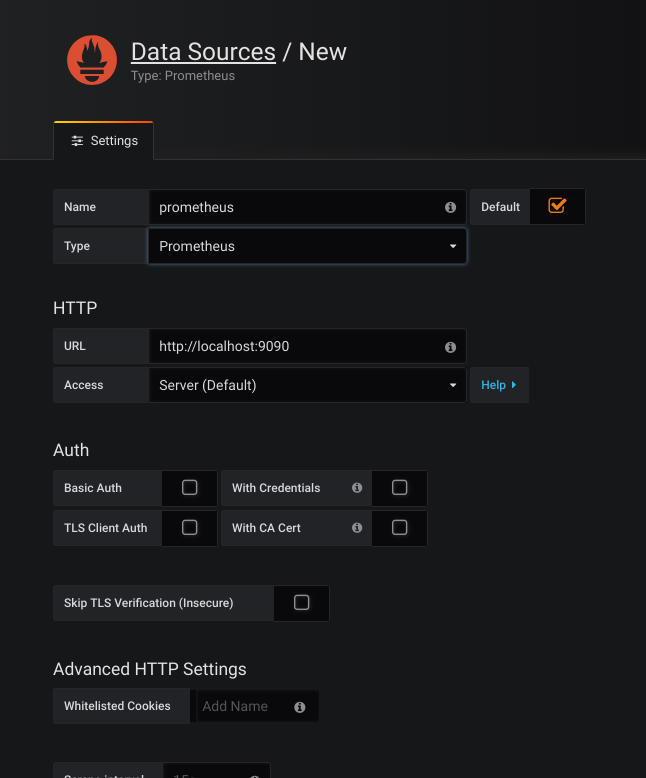
In the following screen:
|
|
|
|
1. Enter a name for the Prometheus data source. Let's name this data source `prometheus`.
|
|
1. Choose `Prometheus` from the `Type` dropdown.
|
|
1. Enter the `http://localhost:9090` value in the HTTP/URL section.
|
|
1. You can leave the remaining settings at default and click `Save & Test`.
|
|
|
|
|
|
|
|
The Prometheus data source is now ready to use in Grafana.
|
|
|
|
#### Importing the Grafana dashboard
|
|
|
|
We have prepared a Grafana dashboard that visualizes the metrics exported by this example.
|
|
|
|
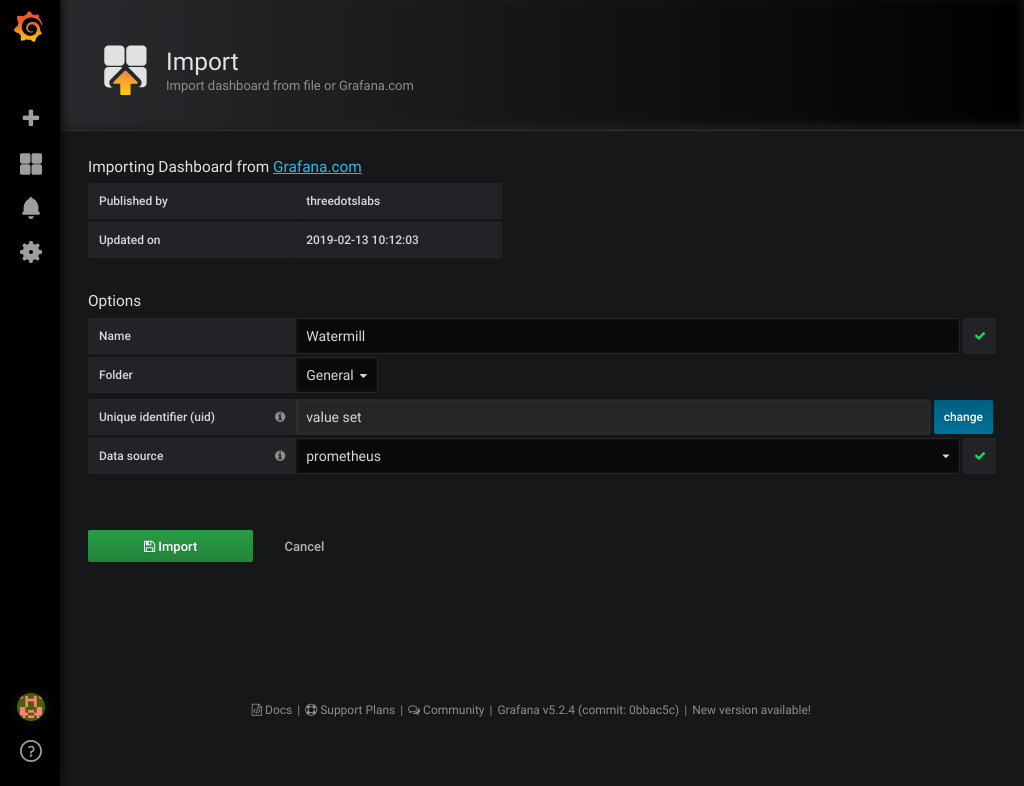
To import the Grafana dashboard, select Dashboard/Manage from the left menu, and then click on `+Import` (or go to http://localhost:3000/dashboard/import).
|
|
|
|
Enter the dashboard URL https://grafana.com/dashboards/9777 (or just the ID, 9777), and click on Load.
|
|
|
|
|
|
|
|
Then select the Prometheus data source created in the previous step. Click on `Import`, and you're done!
|
|
|
|
### Find out more
|
|
|
|
To find out more, about metrics be sure to check out the [Watermill docs](https://watermill.io/docs/metrics).
|